Power, Privilege and the Purse: Mathematics
The "Power, Privilege and the Purse" project was all about finding and discussing about some of the many inequalities that can be found in the United States of America. It was about looking into the inequalities that plague a large portion of society in the US and many around the world. These topics vary from the inequalities women face within the work place involving their treatment and their wages all the way to the way undocumented immigrants are treated within the country and some of the struggle they face within every day life. In Mathematics we created spreadsheets to calculate exactly what bank accounts might save in a certain amount of years or when learning to budget with our ideal minimum wage. We as well studied statistics and learning about the economics behind the working poor and their expenses.
In Mathematics we learned to do taxes and find budgets for different jobs. We also calculated exactly how much we would have to pay for college and how much we would need to take out from loans. Along with that and three spreadsheets to calculate our long, short and medium term savings we were able to budget our money with extreme preciseness. Along with that we found how to calculate for compound interest and compound decay, mostly relating to bank accounts. We learned about interest and most recently we learned about Standard Deviation within Data as well as Z-Scores. I learned of logarithms and exactly how all of these relate to the real world.
In Mathematics we learned to do taxes and find budgets for different jobs. We also calculated exactly how much we would have to pay for college and how much we would need to take out from loans. Along with that and three spreadsheets to calculate our long, short and medium term savings we were able to budget our money with extreme preciseness. Along with that we found how to calculate for compound interest and compound decay, mostly relating to bank accounts. We learned about interest and most recently we learned about Standard Deviation within Data as well as Z-Scores. I learned of logarithms and exactly how all of these relate to the real world.
|
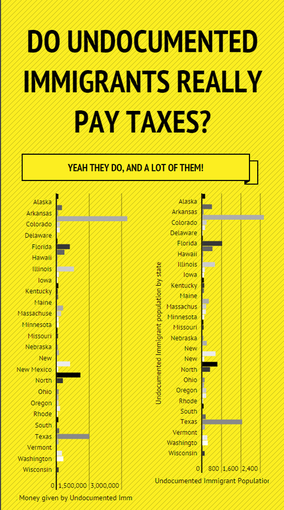
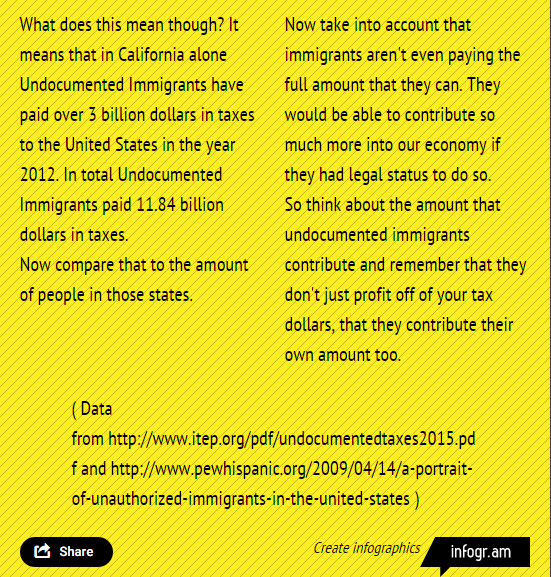
What all of these topics have allowed me to do is to really be able to statistically see exactly how much people are affected by economical issues. The spreadsheet concerning how people making minimum wage earned really helped me open my eyes to exactly see how people really are struggling to live and to provide for their families. I as well created an info graphic on exactly how much undocumented immigrants provide to the United States economy. It is on the right. It compares how much each state makes to the population of undocumented immigrants within that state.
I think that what I can really take from this is to learn from facts and they really do help and change the way you think about certain topics. |
|
|
Sine City
In the Sine City project we looked into the San Marcos Creek Development Project, which is going on across the street from our school. This plan entitles developing a new "downtown" San Marcos area with housing and retail. Thus, our project was to split up the land and have our team design it together, creating our idea of what the new Downtown San Marcos would look like.
|
We began working by taking a visit to our site and looking at the space we had to work with. I was in a group with my good friend Faris and Liana, and our plot of land, at least we originally thought, was about 100ft x 150ft. This meant that when we started to plan our ideas we based it around this one building that would take up most of the space, as it wasn't a lot. So we went through the process thinking we had this small area. We created specific designs that were meant for the small area, and we even started to graph the building on graph paper with the measurements that we thought we had.
After exploring Google Maps for a little while we quickly realized that our plot of land was big enough to fit about 3-4 Costco. So if we just scaled up our original design the building would be gigantic. So we split the area up into four sides where three of them were buildings. |
|
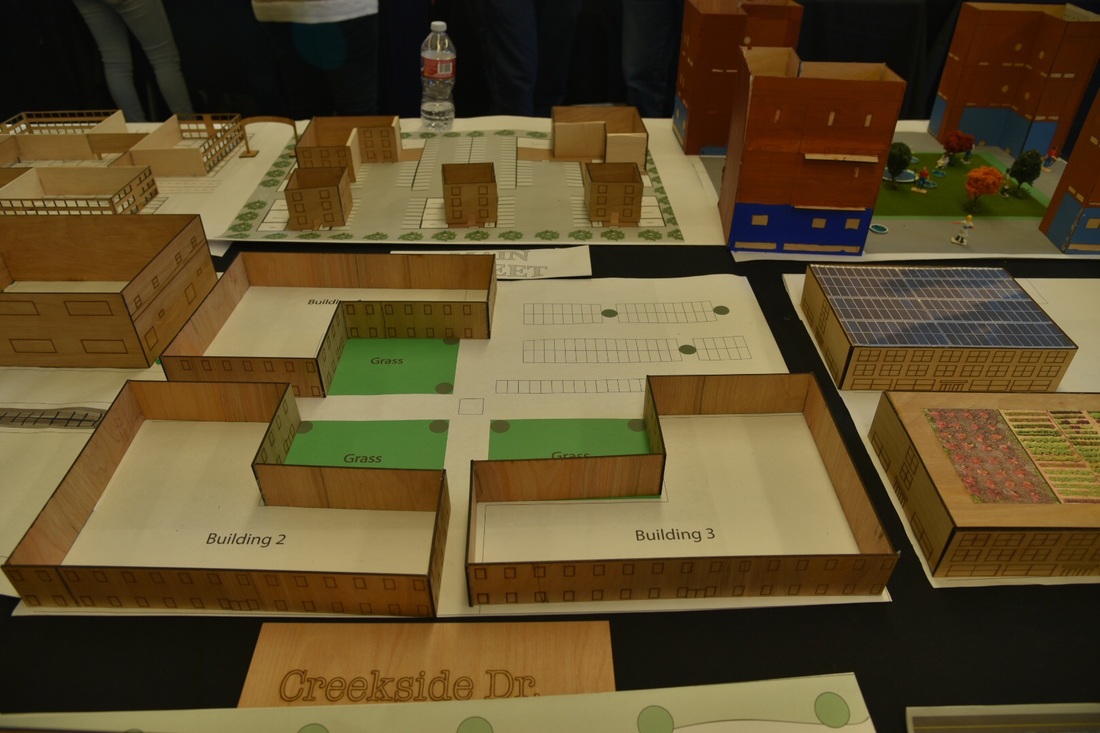
We overcame that challenge and began to work with the online illustrator to create and scale the design. This allowed us to just export the files in our laser cutter, which cut out our wood pieces allowing us to create these 3D models as seen on the right.
Some of the Math involved was really the scaling of our models and ideas that we had throughout the project. Another huge Math concept that was involved heavily in this project was Trigonometry. We used that when finding Sun Path Diagrams to find where the sun would hit our buildings and what parts of the building. As well as trying to find the far awnings should stretch out. We used this as well as incorporating the Golden Ratio into parts of our buildings. We incorporated it in our windows, which all follow the Golden Ratio rules.
Some of the Math involved was really the scaling of our models and ideas that we had throughout the project. Another huge Math concept that was involved heavily in this project was Trigonometry. We used that when finding Sun Path Diagrams to find where the sun would hit our buildings and what parts of the building. As well as trying to find the far awnings should stretch out. We used this as well as incorporating the Golden Ratio into parts of our buildings. We incorporated it in our windows, which all follow the Golden Ratio rules.
|
This project was a great way to gain insight into the world of architecture and design. One of the biggest takeaways was the importance of teamwork and collaboration because I noticed that there were days when one partner would be gone and the other two would be stuck and unsure how to manage the work load given, especially when deadlines were nearing. This also meant having strong communication in between all of the group members to make sure no one is wasting time, while the others are working too much.
As for exhibition everything in my opinion went well. People were interested in what was going on and were participating and actively interested in what the students had done and the process they went through. One thing I found challenging was explaining the math involved, because it was rather simple and easy to explain, so I felt like after I explained that they would say "is that it?". Because mathematically it wasn't rocket science, yet it was all of the other work that made the project challenging and unique. |
